
I’ve been asked a few times now to provide an account of the energy transition modelling featured on Beyond this Brief Anomaly over the past year or so, that goes beyond the very brief article for The Conversation in May, but that is more accessible than the detailed documentation provided in earlier posts here, here and here. The article presented here is intended to fill that gap. It’s based on the presentation I gave in July at a University of Melbourne Carlton Connect Initiative event on energy transitions, discussed in the introduction to this earlier post. The presentation abstract will serve for orientation:
Energy transition discourse in both the public and academic spheres can be characterised by strong and often fixed views about the prospects for particular pathways. Given the unprecedented scale and complexity of the transition task facing humanity, greater circumspection may help ensure collective efforts are effective. While significant attention has been given to the question of how to satisfy future energy demand with renewable sources, dynamic effects during the transition period have received far less attention. Net energy considerations have particular relevance here. Exploratory modelling indicates that such considerations are relevant for more comprehensive feasibility assessment of renewable energy transition pathways. Moreover, this suggests there may be value in asking broader questions about how to ensure energy transition learning and praxis is sufficiently ‘fit for purpose’.
Introduction and study context
In recent years I’ve noted an increasing tendency for energy transition discourse to be characterised by strong and often fixed views about the feasibility of various pathways. It’s this situation that forms the background context for the transition modelling that I’ll introduce shortly. In setting out the rationale for his new book Our Renewable Future [1], Richard Heinberg of the Post Carbon Institute recently summed up the situation as follows:
As just about everyone knows, there are gaping chasms separating the worldviews of fossil fuel promoters, nuclear power advocates, and renewable energy supporters. But crucially, even among those who disdain fossils and nukes, there is a seemingly unbridgeable gulf between those who say that solar and wind power have unstoppable momentum and will eventually bring with them lower energy prices and millions of jobs, and those who say these intermittent energy sources are inherently incapable of sustaining modern industrial societies and can make headway only with massive government subsidies.[source]
The unbridgeable gap Heinberg refers to is between people who see renewable energy, one way or another, as the best bet for our energy futures. Open the field out to include rusted-on fossil fuel adherents, or nuclear enthusiasts, and the polarisation is more extreme again.
At a time when we humans need to be moving towards a greater willingness to work together, this for me is a source of significant concern. Rigid positions can carry high stakes, especially if their foundations turn out to be weaker than anticipated. Humanity is now in a critical zone for the global carbon budget. Kevin Anderson from the Tyndall Centre for Climate Research in the UK describes the situation in the clearest possible terms: ‘low carbon energy supply can’t be built in time for 2°C.’[2] We are now at a point where supply-side energy transition responses, of any shape, can’t alone be relied upon to deliver the required rate of emission reduction.
Given the unprecedented nature and scale of the task before us, it seems fair to ask whether established methods for assessing transition feasibility tell us everything we need to know. Graham Palmer’s hierarchy of renewable energy plans (Figure 1) provides a very useful reference point for thinking about this. He points out that most feasibility assessments consist of energy balances for the post-transition state. These focus on what he calls the ‘simulation layer’, and involve the highest possible level of abstraction.

Figure 1: Graham Palmer’s hierarchy of renewable energy plans. The caption on the original source notes ‘Most plans only consider the top layer.’
[3] (Figure 3.1, p. 13)
The ‘second order layer’ adds a further level of detail relating to important social, environmental and economic questions. This includes issues related to embodied energy and energy return on investment. Graham Palmer’s own research at the Australian-German Climate and Energy College is addressing this area, by developing ways to make energy return on investment indices more effective decision making tools.
The energy transition modelling exercise on which this article is based takes the second order layer as its general starting point, but extends this to include two further ideas:
- From the point of view of maintaining functioning societies during a major energy source transition, power return on investment may be a higher priority issue than life-cycle energy return. (This distinction between power return and energy return may benefit from further explanation. I’ve previously written about power return on investment here and here. I address this further towards the end of the article.)
- We need to look closely at what happens in getting from the present situation to the future situation, rather than focusing just on what the future might look like.
With these departure points in mind, the work discussed here explores the question ‘What happens to global energy supply during the transition phase, when we treat this as a dynamic process of change from the current state to a plausible future state, and when we take into account the significant additional energy demands associated with a major energy transition?’
Model background and design assumptions
Three broad principles shape the approach taken to exploring this question. These are worth keeping in mind when considering the model’s conceptual design and detailed implementation.
- Tracking the full implications of net energy requires a sufficiently comprehensive global view, where there’s no possibility of leaving out hidden energy subsidies through off-shoring effects. And related to this, it’s necessary to take a sufficiently integrated view that can deal with the effective cross-subsidy that a given energy source receives from other sources, and that reflects the quality differences between fuels and electricity.
- The approach I’ve taken is exploratory and isn’t intended to be the last word. The focus is on assessing the sensitivity of overall behaviour to various input parameters, in order to learn about the significance of dynamic effects for assessing the feasibility of transition pathways. This work isn’t about predicting a concrete future, and precision is therefore less important than making sure that the relevant structural relationships are accounted for.
- In the interest of supporting learning-oriented public conversation about energy transition, it’s important to explore the issue in a way that makes all structural assumptions and input values entirely transparent. To satisfy this principle, the model itself should be open access, and should allow anyone with sufficient interest to test how their own assumptions and preferences affect its behaviour.
The model developed to address these broad principles is represented schematically in Figure 2.

Figure 2: schematic diagram of the global energy transition model.
The model provides a physical characterisation of the global economy in terms of energy services in the form of work and heat. The global economy is represented as two sub-systems. First, an energy supply sub-system comprising each major energy source, with each separate source modelled as an independent stock of supply capacity.
The second sub-system is all other economic activity, where the output from the energy sub-system is used to produce goods and services for all purposes. The output from each energy source is converted to a mix of work and heat, via source-specific conversion efficiencies. The flow of work and heat from each source is then aggregated to give the total gross energy service supply.
For each source, a portion of this aggregated flow is then diverted back to cover requirements for new capacity emplacement, and for operation and maintenance. This leaves a net flow of energy services to cover all other economic activity. The central model logic involves attempting to maintain the net flow of energy services at a constant level as the contributions from each source change. The change process is driven by the gradual retirement of fossil fuel supply capacity, and this is replaced primarily by renewable sources.
The model is implemented using the Insight Maker system dynamics platform, which, while fairly basic in functionality, is entirely web-based. It is publicly available here, requiring nothing more than an internet connection and a web browser for access. The model actually runs in the browser itself. A screenshot is shown in Figure 3.

Figure 3: screenshot of the Insight Maker energy transition model implementation (version 2.6).
Approximately 30 of the input parameters are user-adjustable, directly from the browser interface (see sliders and text boxes at right of Figure 3). Anyone can clone the model and make their own modifications to the structure, simply by creating an Insight Maker account.
There are four basic structural assumptions built into this version of the model that need to be kept in mind in looking at the simulation results shortly:
- The transition involves a phase out of all fossil fuel energy supply over roughly 50 years. So we’re looking here at a much more modestly paced transition than what would be needed in order to move to zero carbon energy supply by 2035, for a chance of staying below a 2oC increase in global temperature relative to the pre-industrial baseline;
- During this period biomass, hydro and nuclear each roughly double in size;
- The model uses onshore wind and utility-scale PV to fill the gap in services as fossil fuel contributions decline; and
- Lithium ion battery buffering is used as a proxy for intermittency compensation, without implying that this is necessarily practical or preferable at this scale. It is, however, an increasingly popular view in the public imagination, and its implications are worth exploring in that context.
There are also several significant energy cost exclusions. Including these on the energy sector side of the ledger would further reduce the services available for other economic activity. These include:
- Adjustments to transmission and distribution infrastructure;
- Prime movers such as electric vehicles and other final energy use converters that are required as the proportion of electricity in the final energy mix increases; and
- Redesign and replacement of industrial processes, such as metals production, that are currently dependent on direct use of fossil fuels, both as energy sources and reductants.
Model simulation results and findings
With the foregoing introduction to establish context, we’re now set to look at the actual simulation results, with the model’s reference parameter settings. The chart for total final energy services shown in Figure 4 tells the overall transition story.

Figure 4: total final energy services. Year 0 on the time scale represents 1900, and so the energy transition commences in 2015. The red bar indicates the 50-year transition period.
An explanatory note on the time scale (horizontal axis) may be helpful here. This is shown in units of ‘model simulation time’, with 0 years corresponding with 1900 in calendar time, 100 years with 2000 and 115 years with 2015. The period from 1900 until the start of the global energy transition in 2015 is simply the establishment phase for setting the global energy supply mix. The contributions from each source are very close to the actual values by the time the transition commences, but the trajectories from 1900 to 2015 are intended only to roughly approximate historical behaviour, with the exception of wind and PV. As will become apparent when we look at Figure 5, actual wind and PV emplacement rates (for all sources, including onshore and offshore wind, and rooftop and utility scale PV) are shown from the commencement of significant roll-out in the mid-1990s, until 2015.
Figure 4 shows total final energy services building to a peak between 2000 and 2015. At this point, the effect of net fossil fuel retirement kicks in, and the transition period commences. The net peak is around 6200 GW, and the gross peak around 6600 GW, with the difference between the two being the work and heat used by the energy sector. The region of primary interest here is the 50-year transition period between 2015 and 2065, indicated by the red bar under the time scale.
Of particular note is the decline in net energy services available to the economy between the start of the transition period in 2015, and 2035. For the reference parameter set, the minimum is just under 5500 GW, or around 12 percent below the pre-transition maximum. One of the most notable findings from the modelling exercise is that while the size of this trough is reduced by assuming more favourable values for relevant input parameters, it is never completely eliminated. This is the case even for significantly higher wind and PV emplacement rates. So a decline in net energy services available to the economy, in the early stage of the transition period, is a basic structural feature.
This decline results from the combined effect of two important issues. Firstly, we can expect emplacement accelerations for wind and PV to encounter practical limits. Figure 5 shows the changes in emplacement rates with time. As can be seen here, for the default model run emplacement accelerations are of a similar order to actual historical performance.

Figure 5: changes in the wind and PV emplacement rates with time.
The model uses feed back control to increase the emplacement rates. In principal, feed forward control could be used to increase the rates earlier, in anticipation of the fossil fuel decline. But we’d still face the question of how much faster these could be expected to increase in practice. Here, the rate doubles in around 6 years for PV and a little longer for wind. But each of these then needs to go through two more doublings in less than 15 years. For reference, Figure 6 shows a stacked plot of the emplacement rates for all sources. As this indicates, the combined emplacement rates for wind and PV fairly quickly outstrip the historical rates for all other sources.

Figure 6: Stacked plot of emplacement rates for all sources. CFE = coal-fired electricity; CH = coal-fired heating; NGE = natural gas-fired electricity; NGH = natural gas heating; PTF = petroleum transport fuel; BEFH = biomass-fired electricity, fuels and heating; HE = hydroelectricity; NuE = nuclear electricity.
Figure 7 shows how the installed capacity builds over time. The emplacement rates that we’ve just seen, in addition to more modest rate increases for biomass, hydro and nuclear, are sufficient to maintain overall supply capacity at a constant level for around 10 years. After this, the growth in the contributions from wind and PV results in overall installed capacity building very rapidly.

Figure 7: Stacked plot showing installed supply capacity for all sources.
But now, when we compare the installed capacity with the stacked plot for net energy services (see Figure 8), the second important issue that contributes to the decline shown in Figure 4 becomes apparent. We can see here how the net services from wind and PV grow much more slowly than the installed capacity.

Figure 8: Stacked plot of net energy services from each supply source. PTF = petroleum transport fuel; CFE = coal-fired electricity; NGE = natural gas-fired electricity; CH = coal-fired heating; NGH = natural gas-fired heating; BEFH = biomass-fired electricity, fuels and heating; HE = hydroelectricity; NuE = nuclear electricity; WE = wind electricity; PVE = photovoltaic electricity.
This implies that, especially for sources requiring relatively high up-front energy investment, high acceleration in the emplacement rate acts as a brake on the rate of energy return. During the early stage of the transition, pushing the emplacement rate harder results in diminishing marginal returns on effort. This is particularly significant for PV, but it’s an essential feature of any rapid turnover in energy supply.
Figure 9 provides an indication of the energy sector’s size relative to the rest of the economy. It’s notable that while the situation depicted in the previous charts involves a doubling in energy sector size (the energy services ratio depicted in Figure 9 declines from a maximum of roughly 18 in 2000, to a minimum a little below 9 in 2047), in absolute terms this is not extreme. In fact, when the trough shown in Figure 4 bottoms out around 2035, growth in the energy sector’s service demands accounts directly for only a small fraction of the total shortfall.

Figure 9: Energy services ratio, showing relative sizes of energy sector and ‘rest of the economy’.
It’s worth noting also that this takes into account a significant increase in overall conversion efficiency from final energy to work and heat. This is mainly associated with the increased proportion of electricity in the aggregate energy supply, but it also takes into account general efficiency improvements. The stacked plot of gross power output for all sources shown in Figure 10 indicates the overall effect of the efficiency increase, with around 25 percent less gross output required to deliver the same quantity of services post-transition compared with pre-transition.

Figure 10: stacked plot of gross power output for all sources. PTF = petroleum transport fuel; CFE = coal-fired electricity; NGE = natural gas-fired electricity; CH = coal-fired heating; NGH = natural gas-fired heating; BEFH = biomass-fired electricity, fuels and heating; HE = hydroelectricity; NuE = nuclear electricity; WE = wind electricity; PVE = photovoltaic electricity.
The change in mean conversion efficiency for energy to services is depicted in Figure 11. The green line shows the mean efficiency across all sources for final energy to work and heat increasing from roughly 55 percent to just under 75 percent. Over the same period, efficiency for primary energy to work and heat increases from 40 to 60 percent.
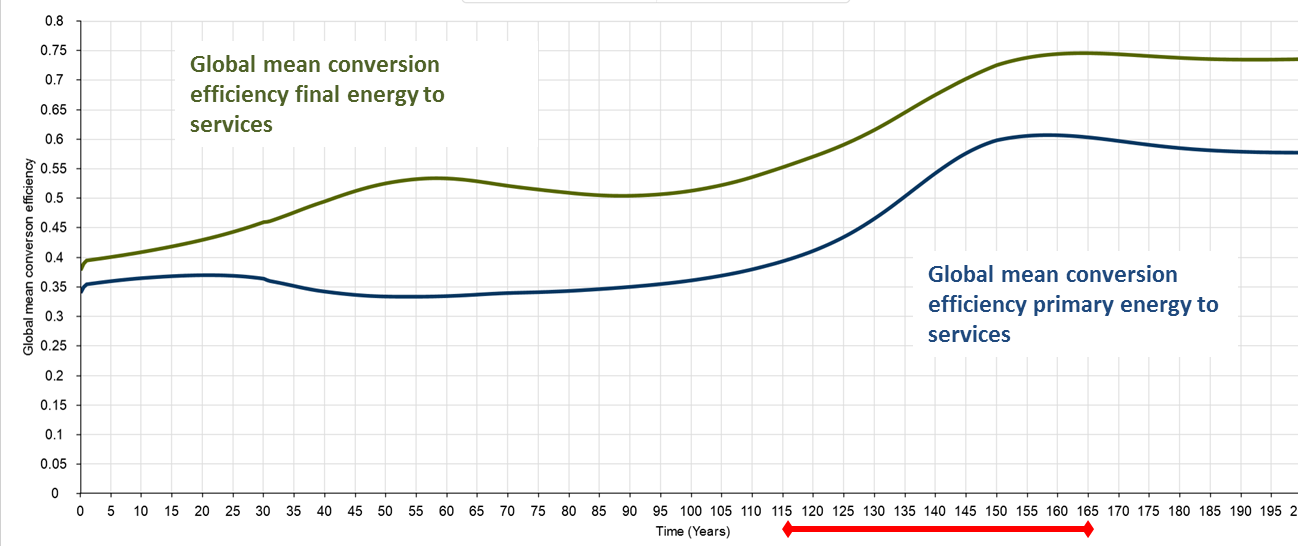
Figure 11: mean conversion efficiency for energy to services (work and heat).
Finally, Figure 12 illustrates what is perhaps the most illuminating finding from the whole exercise. Here, what I’ve referred to as ‘dynamic energy return on investment’ is calculated using the annual output from the total stock of generators for wind or PV, and the total energy expenditure for each source. The time series for this index shows it starting at zero and then increasing to the nominal life-cycle energy return on investment for a single generator only at the end of the transition period, once the overall supply stock has reached steady state. We see the same effect regardless of the life-cycle EROI value. In effect, what we’re seeing here is that the short-term power return on investment may be a significant transition rate constraint, even where life-cycle energy return on investment is favourable.

Figure 12: ‘dynamic energy return on investment’ for wind and PV.
This shift in focus to ‘power return’ recognises that societies are dependent for their continued functioning on sufficient instantaneous rates of energy supply (energy supplied per unit of time), as a separate consideration to the quantity of energy available from a given source over its operating life. While most transition discourse focuses on changes in the sources from which energy is made available for human use, less attention is given to how equivalent rates of energy use can be maintained across the course of the transition. Here it becomes important to think in terms of how much power supply capacity can be made available from a new energy source, for a given investment of power from currently available sources. If we attend only to life-cycle energy return for a source, then this more immediate issue will be obscured. Any energy source that has a higher upfront energy requirement than incumbent sources will by its nature have a lower power return on investment. But even energy sources with relatively favourable upfront energy requirements can give low power return on investment during an unusually rapid turnover of the supply stock.
This insight is a direct result of shifting from a static to a dynamic view of energy transition. This alone could be viewed as proving the case for the importance of the dynamic view. It suggests fairly strongly why net energy considerations should be taken into account in assessing the feasibility of transition pathways.
Provisional conclusions
While there’s still much scope for taking this analysis further, the findings to date point towards a number of broad conclusions that are likely to be fairly robust. The first of these is that the transition task ahead of us is likely to be more challenging than is popularly imagined. Replacing plant and infrastructure will take longer and have wider economic ramifications than is typically suggested by feasibility assessments that focus only on the ‘simulation layer’ in Graham Palmer’s hierarchy of renewable energy plans. It is not simply a matter of swapping out some existing plant and equipment.
In addition to this, the findings from the study support Kevin Anderson’s contention that we’re faced with a mismatch between the decarbonisation rate necessary to reduce the odds of dangerous climate change, and the practically realisable rate of transition to zero-carbon energy supply.
Finally, and I think most significantly, these two findings suggest a clear pathway for reaching beyond the apparent dilemma. This involves a much more serious engagement with demand-side questions, on the basis that any reduction in energy demand reduces the weight that supply-side responses must carry, therefore making the transition task easier. This needs to go well beyond a default focus on technology-mediated efficiency gains. The nature and origin of rich-world societal expectations for energy services, and related questions of cultural priorities, will need to become a far more prominent focus in energy transition efforts. This is not just a task that can be left to political and technical elites. It is a world-shaping endeavour that will affect every global citizen, and for which every one of us should be involved in equal measure.
I close then with a proposition that, to my mind, follows closely from this last point. The proposition is that the most important transition challenge facing humanity may not be about energy supply at all, but about opening our imaginations to new ways of learning together and to different visions of human success. That a transition from fossil fuels to renewable energy sources presents humanity with unprecedented social, political and technical challenges can be approached as a great opportunity. In fact, what is perhaps most remarkable here is that it should be necessary to highlight this at all. As a species, we are perhaps at our best when called to confront major existential challenges. If history is a reliable guide here, what matters is that the challenges with which we’re confronted present opportunities to find meaning and to learn together in our common endeavour. If the situation we now find ourselves in is not typically viewed in such a light, then learning to see it with fresh eyes may open new and altogether more rewarding pathways through the energy transition landscape.
References
[1] Heinberg, Richard, and David Fridley. 2016. Our Renewable Future: Laying the Path for 100% Clean Energy. Washington: Island Press. Online version available at http://ourrenewablefuture.org/.
[2] Anderson, Kevin. ‘The emission case for a radical plan’, presentation for the Radical Emissions Reduction Conference, Royal Society, London, December 2013. Viewed 1 July 2016 at http://www.tyndall.ac.uk/sites/default/files/anderson_-_radical_plan_conf.pdf.
[3] Palmer, Graham. 2014. Energy in Australia: Peak Oil, Solar Power, and Asia’s Economic Growth. Hall, C. A. S. (Ed.). Springer, New York.
[4] Bolton, Ronan. 2016. ‘Electricity market reform – a shared complex challenge’, presentation for EU Perspectives on the Energy Transition, Carlton Connect Initiative, University of Melbourne, 13 July. Presentation slides available here.

Terrific piece again Josh. Its an unforgiving reality that is bumping into our preferences. I have also been seeing ideas like these starting to crop up in other blogs now too. Two that come to mind are Ugo Bardi trying out the notion of “don’t eat your seed corn” – which is worth watching – and today’s post by Roger Andrews where he looked an the forecast total energy demands from a range of lead agencies and none of them show curves that look anything like your ‘suggestions’. It does suggest that the reality v beliefs gap is going to widen a bit more before bits start to fall off. Once again thank you for doing this oh so valuable but largely unrecognised great work
Hi Peter, I’ve seen the “sower’s dilemma” article from Ugo Bardi and colleagues — is that the one you’re referring to? Sounds like there might be some further material based on the article to have a look at? I’ll have a look at the Roger Andrews article too, thanks for the heads up.
At 4,200+ words and 12 very complex diagrams, I don’t think it has been “simplified” enough yet. In fact I would hate to be put in the position of summarising your thrust further.
Most detailed newspaper articles consist of one picture and 600 words and are written for an audience with a mental age of 13. There – something for you to do over the weekend 🙂
Palloy, that would be because this isn’t intended to do the job of a newspaper article — see the article in The Conversation (linked at top) for something more along those lines. Thanks for sharing your thoughts all the same.
Fair enough, my mistake – I thought the 1000-word Conversation article left a simplification gap BELOW it too, as well as above it.
Remember E.F. Schumacher’s famous quote from the 1970s: “Infinite growth of material consumption in a finite world is an impossibility.” ? It is famous because people (and even some politicians) can understand it the first time they hear it, and perhaps realise the existential threat that Business As Usual thinking poses. It is only THEN that some will seek to know more and dig deeper.
“It takes a lot of Australian coal exports to China for them to make a billion solar panels and export them back to Australia, so Aussies can stop using coal and ‘Save The Planet’. ” [Photos of a gigantic mountain of coal and a row of solar panels on a roof]
To which everyone automatically thinks “OK, how much? Will it work out?”, and off you go. Of course it’s complicated, the more so the deeper you go, and in the end, there is your model.
To my mind, to start with the model and work backwards towards the simple, is to cut off your audience at the start.
Ah, I see — it looks like you’ve assumed I set out to write a different article to the one that I wrote. No, this is actually the one I intended to write. One of the wonderful things about writing is that it’s effectively an infinite resource — when I write something, it does nothing to diminish the opportunity for someone else to write what they’d prefer to see. So please, go right ahead and write that article that you think is more appropriate.
Josh, similar to Palloy’s remark it strikes me that this piece is almost a journal article which brings me to a far more important second point: I would be more inclined (and I think many others would too) to give your thought provoking conclusions the seriousness attention they probably deserve if your work had been subjected to a thorough peer review. And I don’t mean the largely fake peer review of a journal like Futures or other futures journal (in my experience what counts as peer review in such journal is often pretty lax); I mean peer view by a specialist journal whose editorial board contains the necessary specialist knowledge and expertise (e.g. in energy modelling, etc). In this respect I think it’s often very important to respect related scientific norms. We generally expect the work of climate scientists to be peer reviewed before they’re taken seriously, e.g. for use in policy-making, and people who publish results without going through peer review often rightly get criticised; the same could be seem as applying to your work. Consequently, it would be good to hear if you have any plans to publish.
Thanks for dropping by here Steve. As a member of the editorial board of the journal Futures, I’m not really sure what to make of your comment about the quality of its peer review process. It doesn’t reflect my experience, either as an author or as a reviewer. I dare say that authors whose work I’ve personally reviewed would find it fairly perplexing too. That’s not a matter that I’m interested in taking up further here though, as it’s not relevant to the inquiry.
In response to your question, the short answer is no, I don’t have any immediate plans to publish the work as it currently stands via a peer-reviewed journal in the energy field. This particular exercise is quite intentionally framed as a contribution to a different form of inquiry (see the inquiry’s terms of reference). Consistent with the inquiry’s broader framing, I’ve taken the alternative approach of making the entire model publicly available and completely transparent. It’s unusual in my experience for the actual models on which published findings are based to be accessible to researchers’ peers (either as reviewers or as readers of published work). And while yes, pre-publication peer review of articles is currently the standard convention for quality control in scientific research, it doesn’t provide any absolute guarantees in that respect — certainly not to the extent that readers should treat it as a substitute for making their own critical judgements about the merits of the underlying work. Where the work is model based, they’re usually hampered in this by the the simple fact of the model not being available to them to inspect. So in that respect, what I’ve provided here could be viewed as a significant improvement over the situation that the conventional publication model provides.
But that’s all leaving aside the broader context for the exercise, which makes the foregoing issues somewhat moot. The model was originally conceived as a support for people to think together more effectively about the effect of net energy considerations on energy transition (background is discussed in detail here). That’s the basis on which I’ve made it available — allowing anyone with sufficient interest to explore the “scenario space” that its structure delineates, by seeing how their own input assumptions affect the simulated behaviour (or even modifying that structure to reflect alternative understandings of the relationships on which it’s based). Is it likely that many will take up that opportunity? Not really. But the exercise serves as an exploration of some of the “minimal conditions” necessary for a coherent conversation about these issues. In that sense, it’s a provocation to thinking about thinking on energy transition, and specifically intended to support a public space of open and ongoing inquiry consistent with that, not a basis for arriving at concrete certainties (hence my personal disinterest in presenting the work in line with others’ expectations — though others are entirely welcome to pursue their own efforts along those lines based on the tool I’ve made available).
Given you don’t have plans to publish an alternative could be to target people with relevant expertise and invite them to explore and “review” this work and then publish their views on this blog. One of the issues with making this work publicly available in the way you have now is that few people have the capacity to meaningfully engage with it (I put myself in this category, by the way). A model like the one you’ve put together is full of so many design choices and inbuilt assumptions that few people can actually properly understand these choices and assumptions to the extent necessary to properly interpret the results and/or to make alternative choices in the model and then properly interpret any changes to the results that flow from these choices.
Additionally, although my comment about the quality of peer review processes in futures journals aren’t directly relevant to your inquiry I still think I should briefly elaborate given your reaction to my comments. The core issue is that peer review in highly interdisciplinary and fairly inchoate fields (like futures studies or foresight) is often poor when compared with more mature fields that involve a single main discipline or limited number of disciplines (where you therefore have specialists reviewing work within a more narrowly defined field of inquiry). This is not an opinion; it’s been empirically demonstrated many times over that peer review is often poor in highly interdisciplinary fields and this can lead to publishing work that shouldn’t have been. It’s also one of the reasons why highly interdisciplinary journals often have a much lower ranking than disciplinary journals. This is not a comment on your own reviewing for Futures – the little I know about your work and general approach leads me to be highly confident that your reviewing is extremely thorough and professional – it’s a more general comment.
That’s right, making it publicly available is not the same as universally accessible. I don’t expect widespread engagement with the details. That would require a degree of effort that I’m fully aware very few will invest. But the fact that engagement is actually possible for anyone sufficiently interested offers an unusual opportunity for those who are. The detailed, plain language (i.e. not expressed mathematically) documentation of the model structure and default input parameters that I’ve made available in addition to the model itself extends accessibility well beyond the supplementary material that typically accompanies publications related to model-based studies. That’s pitched for the significant community of non-specialists with a deep interest in the issues that the exercise explores — and who are able to interpret the significance of the design choices and assumptions, if they’re provided the opportunity to do so. For the most part, model-based studies exclude people with that level of interest from participation altogether.
My understanding of the matter of peer review quality and work being published that “shouldn’t have been” (always a question of value judgement, and often not reducible to empirical questions) is more nuanced than “interdisciplinary journals are weak, single discipline journals are poor”. But as I said, this isn’t the place for such a conversation. I will just make the observation that a journal’s focus on a narrow disciplinary range provides no guarantee that the research it publishes is valid, or will be accepted by readers as valid (and in fact peer review provides no such guarantee). A couple of highly relevant examples: Ferroni and Hopkirk’s recent article in Energy Policy which has attracted much criticism along the lines that “it shouldn’t have been published”; and the high profile researchers whose 2005 estimate of global technical potential for wind energy extraction (J of Geophysical Research: Atmospheres) was revised down by an order of magnitude in a subsequent study published in a 2012 PNAS article, as a result of taking energy conservation into account(!). To the best of my knowledge, the earlier findings weren’t retracted as a result of that downward revision, nor were findings of the high profile global renewable energy transition feasibility studies based on them (though I’d happily be corrected on this).
By the way, for some high level model cross-validation, you could compare some of the key simulation results in figures here (e.g. combined installation rates for all sources) with those reported by Sgouridis, Csala and Bardi in their Sower’s Way study just published. That study deals with very similar questions, and the findings are broadly consistent with mine. A glance over their supplementary material would give you a sense of what I mean by greater accessibility of background material I’ve provided. For a detailed point of validation, you could also compare the historical portion (2000 to 2015) of the dynamic EROI trendline for PV in figure 12 with findings from Dale and Bensen’s ‘Energy Balance of the Global Photovoltaic (PV) Industry – Is the PV Industry a Net Electricity Producer?’ (2013). There’s quite a flurry of work going on in this area at the moment.
The Sower’s Way study is also a useful reference point re: verification of key model concepts. Even better for that though is Neumeyer and Goldston’s paper from this year ‘Dynamic EROI Assessment of the IPCC 21st Century Electricity Production Scenario’.
Thanks for the links to other relevant papers – I plan to review them as I’d like to better familiarise myself with this literature. I think the line of inquiry in your project is an important one and, as you note, an expanding area of research. I know plenty of folk who think that a transition to 100% renewables will be fairly simple and that the task of shifting energy supply from current to renewables is just a matter of public enthusiasm and/or political will. People that question this often aren’t popular and sometimes accused of unnecessarily making the job of climate action advocates more difficult. So I don’t want to unnecessarily add to any (possible) pushback you have received.
Still, if you do invite reviews of your work and publish the feedback you receive on this blog/website (as per the suggestion in my previous comment to target individuals who are well placed to review/comment on your work) I think this is likely to be valuable… either in terms of what you learn (from the feedback) and/or enhanced credibility. Whether the latter considerations are important depends, in part, on who you’re targetting or wish to influence.
Thanks Steve, they’re very good thoughts, and I agree there’d be much value in that. I’ll definitely keep you posted.
We are heading into uncharted waters with little previous examples of how we should proceed. As you have noted here, “As a species, we are perhaps at our best when called to confront major existential challenges. If history is a reliable guide here, what matters is that the challenges with which we’re confronted present opportunities to find meaning and to learn together in our common endeavour.” Our ability to adapt to changes in our circumstances is one of our greatest ‘saving graces’ and how we transition through this period will depend greatly on this.
Hi Josh.
I’ve read BTBA from start to finish over the last couple of years. It’s an amazing (I dare not use the word ‘incredible’) piece of work.
I admit that I was struggling to stay engaged with the ‘technicalities’ on some of the later posts – to the point where I found it tough going and thought I would not be able to continue the journey. All my problem, not yours, I would add!
However to reach the (provisional) conclusions in this post and read: “The proposition is that the most important transition challenge facing humanity may not be about energy supply at all, but about opening our imaginations to new ways of learning together and to different visions of human success.” was a great relief and made me smile.
What a leap, from the world of highly technical energy related detail (not to dismiss the related social constructions) and into the world of human relationships. In the end this is no big surprise, I suppose, for those of us engaged and concerned (professionally or otherwise) with ‘sustainability’.
The ‘relief’ I feel, in one sense, is that your proposition does point to an area where some of us may be able to (re)focus and invest our personal energies to better effect than in ‘worrying about’ the energy transition. I think I came to a similar conclusion on the subject of tackling ‘climate change’ some years ago. It’s less about the hard-ware (technology) then it is about the soft-ware (who is using it). And it’s too easy (me included) to focus on the hard-ware, which appears to be easier to manage and much more logical. 🙂
Many thanks for these reflections, Tony — and for sticking with the inquiry through its twists and turns. I think your closing lines get to the heart of things: “It’s less about the hard-ware (technology) then it is about the soft-ware (who is using it). And it’s too easy (me included) to focus on the hard-ware, which appears to be easier to manage and much more logical.” In due course, I hope to delve a little further into that experience of struggle you’ve mentioned in engaging with the technicalities. I think it may have something very important to say about the nature and origins of humanity’s present situation. For now though, you’ve provided a good opening for me to mention the strangely ambivalent relationship I have with this type of work. On one hand, I find it very easy to immerse myself in this analysis, and in fact it creates a kind of self-reinforcing compulsion to pursue a line of inquiry further. But at the same time it can be very draining. It’s a logic puzzle to be untangled, rather than a source of creative joy. There’s something in all this that brings to mind this autobiographical reflection from Charles Darwin:
Hear, Hear!
Thanks for the Charles Darwin quote, and your continued discussion.
You’re welcome. There does seems to be a steadily growing theme emerging around this in inquiry related to “humanity futures”. It came up in another conversation recently as the role for “poets not quants” in learning about what’s going on.
This so neatly leads me to bring to your attention the work of Paul Kingsnorth (et al) in founding http://dark-mountain.net. I hope I am correct in summarising that Paul came to a conclusion (in some way related to your Darwin quote) that immersion in solving ‘sustainability’ issues at a technical level was (for him) both a distraction and disheartening. Thus the Dark Mountain Project aims to seek understanding and responses through the creative arts. Primarily this revolves around ways of creating and telling stories, old, present and new. This video neatly presents Paul and Dougald’s viewpoint: http://tinyurl.com/haljrzb
That is exactly what another person who was part of the ‘poets not quants’ conversation spotted also. I could only agree then, as now — I’ve been following the Dark Mountain Project with interest since fairly early on, and have a very similar sense. And I recall having a similar response to that video when it was first published — the retrospective view, and especially the opportunity to reflect on how critics had tried to make sense of what they were doing, made it quite apparent that the cultural current Paul and Dougald were giving expression to wasn’t going to reduce to any neatly familiar and hence dismissable framing. There are other knowings and other worlds; they might only be a tiny sidestep removed from where we are, and that might still be a universe away.
Pingback: Your Tuesday Morning Collapse | Loki's Revenge
Excellent arguments about the need to collaborate. In Japan, the centre-right is unfolding a distributed-energy paradigm that stresses resilience to hazards, including earthquakes and climate change (intense rain, typhoons, sea level rise, etc). In other words, they use aggressive adaptation (national and subnational planning) to achieve mitigation via distributed energy systems. The governance mechanism is horizontal collaboration among central agencies, plus broad vertical collaboration between the centre and subnational governments, business, academe, civil society, etc. One result is disaster-resilient, renewable-microgrid Higashi-Matsushima City (http://techon.nikkeibp.co.jp/atclen/news_en/15mk/082200781/?ST=msbe&P=1).
But the political left loathes the current government, and hence refuses to build on the constructive aspects of this paradigm. One option would be for them to argue that “Abenomics” does not include adequate emphasis on microgrids, district heating, and energy management systems, along with renewable projects, and that the country is less resilient than it could be. Yet because everything they do gets coopted, they’re instead focused on nuclear restarts, which helps maintain their shrinking base. They ignore disaster-resilient smart communities and pretend “citizen power” initiatives can somehow succeed in reshaping the landscape of power generation, transmission, consumption (not to mention the rest of the energy economy), while displacing nuclear and coal.
Were I a betting person, I’d wager on the collaborative technocrats. This is not only because they are in power and shaping policy to build resilient local communities. Another reason is that their approach has public support: Japan’s annual and authoritative “Environmental Consciousness Survey,” released last month, shows that the country’s strongest level of consensus for anything related to energy and the environment is the 77.8% support for using public funds to build resilience in the face of climate change.
Thanks Andrew for sharing these insights on Japan. I must admit I’m not well informed on what’s happening in your neck of the woods, so I’m very glad to learn about the success of this approach. It sounds like it has a great deal of promise as a model applicable well beyond Japan too. Though sorry also to hear that it’s meeting with such resistance from a quarter that at face value one might assume to be a natural supporter (of course I’m making that observation from an Australian perspective, and why that default political framing should apply at all is a whole other story in itself, isn’t it?!). The picture you’ve sketched out here of the collaborative technocrats (and why their way is working) is a very handy trigger for thinking right now. I think it might link up along the way with where the inquiry here seems to be heading. Very much appreciated.