
The first installment of this two-part series set out the case for why carbon offsetting is incompatible with serious response to climate change, and looked specifically at what this implies for rich-world attachment to air travel.
In coming to terms with why this does actually matter, there is a further basic question that needs grappling with: why should flying in particular be singled out for such scrutiny? It’s hardly the largest source of emissions overall, so why give it such weight? With carbon dioxide from aviation accounting for just 2 percent of total global carbon dioxide emissions (roughly 12 percent of CO2 emissions from transport, which in turn is 15 percent of the global total) the concern I’m expressing might seem thoroughly misplaced. Even for Australia, direct aviation emissions account only for 3.1 percent of the national total for all greenhouse gases (i.e. on a Global Warming Potential CO2 equivalent basis, rather than in terms of CO2 alone). I suspect this may in fact play a substantial part in why broader cultural attitudes diverge so sharply from my own.
There is a two-level problem with this apparently obvious but far too simplistic view.
The more mundane level relates to the actual climate impact of emissions from aviation. Here the full range of combustion products must be taken into account, not just carbon dioxide. To this, the increased warming effect of emitting these gases at high altitude needs to be included. And then there is a further impact associated with aviation’s effects on cloud formation. When these are added together, the overall climate impact is conservatively estimated to be more than double the impact of the carbon dioxide emitted by fuel burning on its own.[1]
At this level, the growth in aviation emissions also demands close consideration. The International Civil Aviation Organization’s baseline growth projection would see carbon dioxide emissions (including upstream contributions from fuel production) more than triple between now and 2050.[2] Even with the full range of emission reduction hopes in place, increase in travel demand would lead to emissions more than doubling. This is at a time when remaining within the carbon budget for a nominal 67 percent chance of remaining below 2oC requires that net global emissions reduce to zero by 2050, and probably much sooner. Taking these factors together, the ‘2 percent’ of global emissions looks more like 5 percent in terms of actual climate impact, and is clearly heading very rapidly in exactly the opposite direction to what is needed. And this is without including the other emissions that co-occur with or are enabled by ubiquitous air travel and that would otherwise be far more modest. The most obvious examples here are associated with the global hospitality and tourism industries, but aviation also plays a broader systemic role in enabling and encouraging more energy and emission intensive forms of economic development.
The second level of the problem has far more profound implications. The global average view depicts climate change in fairly crude physical terms. If we’re to deal with it at all adequately, a shift is needed towards viewing it principally as a social and cultural phenomenon. Aviation’s 2 percent share of global carbon dioxide emissions takes on a very different character when we look at who enjoys the benefits, and who bears the costs. It is overwhelmingly the world’s richest citizens who are responsible for these emissions, and yet it is the poorest people, with the least significant carbon footprints, and who have benefited least from past emissions, who are most vulnerable to climate change. This is aviation’s unavoidable dirty underbelly.
To see this more clearly, it’s necessary to consider not only how emissions are distributed between nations, but also between more and less affluent people within nations. This brings us back to the overview of the global carbon budget in Part 1. As discussed there, if we take the Australian Climate Change Authority’s recommendation as our reference, total global emissions for all greenhouse gases must not exceed 890 Gt CO2-e between now and 2050 for a 67 percent chance of staying below 2oC. This includes 614 Gt CO2 from fossil fuel burning and industrial processes.
Global population is currently 7.4 billion, and is forecast to rise to around 9.5 billion in 2050. If we assume linear population growth, an equal distribution of the remaining emission budget per person per year would be 3.1 t CO2-e per person-year for all GHGs, including 2.2 t CO2 per person-year from fossil fuels. Note that this is an equal distribution, as distinct from an equitable distribution. An equitable distribution would consider the relative affluence of people, and the role that past emissions have played in providing that. A strong moral case can be made that those who have benefited less from past emissions should receive a greater share of the remaining budget.
In 2014 the global emission rate was approximately 36 Gt CO2 per year. This corresponds with an average global per capita rate of around 4.9 t CO2 per year. Against this figure we can compare a sample of national averages, as shown in Table 1 below.
| Region or country | Emissions in 2014 (t CO2 per capita) | GDP per capita in 2015, PPP (current international $) | Air transport passengers carried per capita in 2015 |
| Qatar | 39.1 | 143,788 | 11.30 |
| Australia | 17.3 | 45,514 | 2.91 |
| United States | 16.5 | 55,837 | 2.48 |
| Germany | 9.3 | 47,268 | 1.42 |
| China | 7.6 | 14,239 | 0.32 |
| European Union | 6.7 | 37,676 | 1.28 |
| United Kingdom | 6.5 | 41,325 | 2.02 |
| Spain | 5.1 | 34,527 | 1.31 |
| France | 5.0 | 39,678 | 0.97 |
| World | 4.9 | 15,465 | 0.46 |
| Chile | 4.4 | 22,316 | 0.84 |
| Mexico | 3.7 | 17,277 | 0.36 |
| Brazil | 2.5 | 15,359 | 0.49 |
| India | 1.8 | 6,089 | 0.08 |
| Indonesia | 1.8 | 11,035 | 0.34 |
| Costa Rica | 1.6 | 15,377 | 0.34 |
| Nigeria | 0.5 | 5,992 | 0.02 |
| Nepal | 0.2 | 2,458 | 0.02 |
Table 1: Per capita carbon dioxide emissions from fossil fuel burning and industrial processes, GDP and air transport passengers carried for a selection of countries and regions. Sources: Per capita emissions from http://edgar.jrc.ec.europa.eu/overview.php?v=CO2ts_pc1990-2014; Air transport passengers carried from http://data.worldbank.org/indicator/IS.AIR.PSGR; GDP per capita http://data.worldbank.org/indicator/NY.GDP.PCAP.PP.CD. Note: GDP per capita is on purchasing power parity basis (PPP).
It’s immediately apparent from this data that there’s a strong general tendency for higher average emissions to correlate with greater average affluence at the national level, though there are significant anomalies also. China is especially notable—with its high emissions resulting from high reliance on coal for its recent massive economic expansion. India’s similar though far more modest situation is also reflected in the data.
This correlation holds up very closely when we look also at average numbers of air passengers for these countries on a per capita basis. Where emissions per capita are high, and GDP per capita is similarly high, the average number of air trips per person is also high. This shows clearly how affluence, high use of air travel and high per capita emissions go together, as we might expect.
So while aviation might account for 2 percent of global carbon dioxide emissions, it certainly doesn’t account for 2 percent of the emissions attributable to each individual. Rather, for a relatively small proportion of individuals aviation accounts for far more than 2 percent of emissions, while for a much larger proportion it is negligible or zero. When we look at what would be involved in distributing the remaining emission budget equitably—or even just equally—aviation takes on far greater significance. Mitigation potential, and connected with this, mitigation responsibility, is not equally distributed. Those whose emissions are currently higher than the global average have far greater scope to contribute. This is especially so when the luxury status of emissions significantly beyond the average level is recognised. Extreme emission lifestyles are categorically not a matter of necessity, but of choice, for those with the means to afford them.
That the Air Travel Action Group (an industry body ‘working to promote aviation’s sustainable growth’) can claim straight faced ‘there is no practical alternative mode of transport’ for travel ‘over 1,500 kilometres’, simply highlights the self-perpetuating, self-interested and demand-inducing cultural lock-in created by the aviation industry’s very presence. The billions of people from the world’s least affluent classes, who are barred from participation and routinely get by without it, could be excused for viewing this with some disdain. And I’ll set aside further comment on the contempt displayed for thousands of years of pre-1970 history.
The time dimension is absent here. It’s the simple fact that flying is the only means of traveling 1,500 kilometres in a couple of hours that is key to understanding why it is so easily accepted as ‘essential’. That and the intoxicating sense of individual empowerment that near instantaneous shifts in physical and cultural context brings with it. In a world where ‘hypermobility‘ becomes routine, many people are locked in to participation, even where they might prefer to opt out. And non-participation, whether by political or economic exclusion or by choice, carries costs in terms of access to opportunities that assume its availability and use.
Taking ‘reduction potential’ personally
To illustrate the reduction potential that opens up on shifting view from national averages to individual accountability, I’ll now take a look at a concrete example: that of my own emissions. Figure 1 shows an estimate of cumulative emissions and climate impact from air travel, for all trips I’ve ever taken. Flight distances (not shown in the chart), emissions and climate impact were all estimated using the atmosfair online calculator. The climate impact index takes into account non-CO2 effects including other GHGs and contrails, using a multiplier averaging approximately 2.6.
A caveat here is that the calculator is intended for current emissions, and as aircraft fuel efficiency has increased significantly since most of this travel was accrued, this is likely to underestimate actual emissions quite considerably. On the other hand, the climate impact index is weighted towards shorter term impacts, and therefore doesn’t apply in full to a large proportion of these emissions. A reasonable estimate for the purpose of this exercise is probably something midway between the cumulative emissions and cumulative climate impact shown. I’ll assume 90 t CO2.
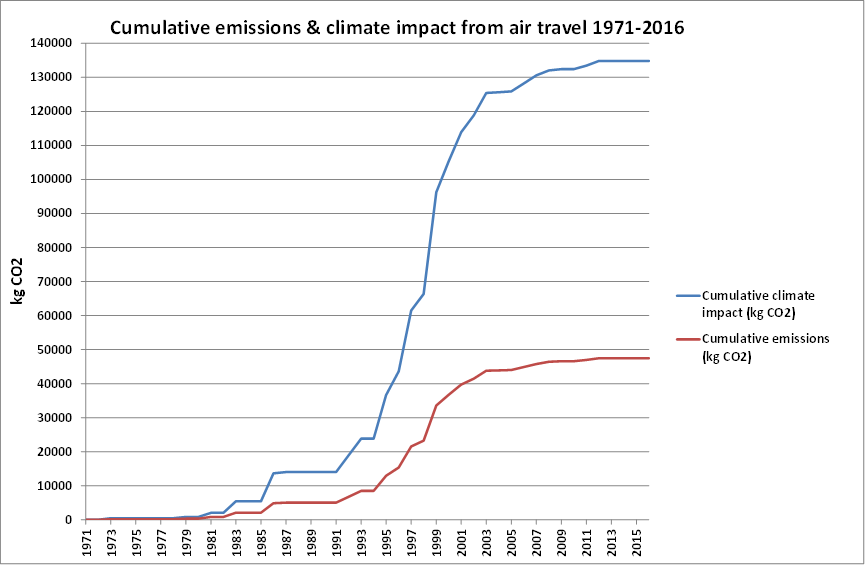
Figure 1: Estimate of my own lifetime cumulative emissions and climate impact from air travel.
Averaged over my 45 years to date, this equates to 2 t CO2 per year. In 1999 though, I flew over 105,000 kilometres: two trips to China, a trip to the USA and a separate trip to Peru via the USA, all for work. That year, CO2 emissions were over 10 t, and climate impact may be as high as 20 t CO2. Over the ten years from 1993 to 2003 I flew a total of more than 412,000 kilometres, with cumulative CO2 emissions of almost 38 t, and climate impact of something in the order of 70 t CO2, or 7 t CO2 per year. Had I continued on that career and lifestyle path, my cumulative CO2 emissions from flying would now be well over 100 t, with cumulative climate impact well in excess of 200 t CO2 – and could quite easily have been substantially higher again.
It’s instructive to consider just the relationship between my lifetime average CO2 emissions (a bit over 1 t per year), and Australia’s (very high) average CO2 emissions in 2015 of 17.3 t per capita. Every gram of carbon dioxide emitted to the atmosphere from flights I’ve taken during my life is indisputably still having a warming effect, prior to considering any multiplier for climate impact. So even that quite meagre lifetime average amounts to more than 6 percent of the per capita average emissions, roughly double the average share from aviation in the national greenhouse gas accounts.
If I do the same for the average over the ten year period of much more intensive air travel from 1993 to 2003, my CO2 emissions for flying were around 22 percent of the per capita total. Adjusting for climate impact, this might increase to as high as 40 percent.
And looking at 1999, my most extreme year, direct CO2 emissions from air travel were 58 percent of the current per capita total. Were I to travel that distance this year, then the full climate impact as per the atmosfair calculator would apply, for a whopping 173 percent of the per capita total.
But its when we look beyond the Australian context as the basis of comparison that the scale really hits home. The full climate impact of emissions equivalent to mine for 1999 is over six times the global per capita total. Consider Nepal though—a country with close to the lowest per capita emissions. There, the multiple is around 150 times.
Here we start to see in the starkest of terms what aviation’s real role is in climate change. My travel in 1999 would not be considered unusual by many rich-world citizens—in fact it wouldn’t be at all noteworthy. I do recall that the United Airlines frequent flyer program was mildly impressed, because on crossing the 100,000 kilometre threshold that year they briefly promoted me one level (to bronze) in their status system. But they made sure to leave plenty of aspirational headroom beyond that.
Even averaging the emissions over a lifetime, I’ve already enjoyed more than my fair share of the world’s carbon budget—inflicting climate damage that even the most elaborate story spun about ‘net benefit’ would have a hard time justifying. At some point surely we have to confront the question of how much is enough?
Many of those who regularly travel distances such as I did in 1999 also claim to be concerned about climate change. Some are even the scientists and political activists calling most loudly for collective action. And here I have to ask how this could possibly be compatible. How on earth are others going to take the message seriously, when by their own actions they are sending the unambiguous message that they don’t take it seriously enough themselves to shoulder their share of the mitigation costs?
Flying and the carbon budget: nowhere left to hide
Before concluding, there’s one other way of framing this that I’d like to unpack. Many people who voice concern about climate change but who continue to fly (and to buy offsets) do make significant emission reductions in other areas. Is it possible to live within a 2oC compatible emission budget (at least in the short term as we use up what remains of it) while continuing to fly? This time I’ll use my own household emissions as a reference point, as shown in Table 2.
| Direct energy use source | Quantity and basis (household level for family of 4) | Emission intensity | Emissions—household total (kg CO2-e/year) | Emissions—individual (kg CO2-e/year) |
| Petrol | 540 L per year (8 year average) | Combined Scope 1 & 3 EF = 72.4 kg CO2-e/GJ; 34.2 GJ/kL | 1337 | 334 |
| Diesel | 170 L per year (3 year average for annual camping trips) | Combined Scope 1 & 3 EF = 74.8 kg CO2-e/GJ; 38.6 GJ/kL | 491 | 123 |
| Electricity | 2230 kWh per year (8 year average, including allowance for use on holidays away from home) | Combined Scope 2 & 3 EF = 1.34 kg CO2-e/kWh (Victoria; latest estimate @ 2014) | 2988 | 747 |
| Natural gas | 12800 MJ per year (8 year average) | Combined Scope 1 & 3 EF = 55.23 kg CO2-e/GJ | 707 | 177 |
| LPG | 60 kg per year (generous estimate for barbecue use and camping) | Combined Scope 1 & 3 EF = 64.9 kg CO2-e/GJ; 25.7 GJ/kL [49.6 GJ/t] | 193 | 48 |
Table 2: Household direct energy use emissions. Source for emission intensity factors is Australian Government National Greenhouse Accounts Factors 2014. Includes direct plus indirect emissions (for electricity and fuel production and supply).
On top of the emissions included in the table, a rough estimate of emissions for food and other consumption for our four person household comes in at 5,000 kg CO2-e/year or 1250 kg CO2-e/year per person. Waste emissions are negligible (both of these via the EPA Victoria calculator). The total of our household-level energy use emissions is 1,430 kg CO2-e/year per person. The combined total for our energy use, food and other consumption is 2,680 kg CO2-e/year per person.
According to the EPA Victoria calculator, emissions for a ‘green household’ of the same size and location, excluding air travel, would be 3,710 kg CO2-e/year per person. For a ‘typical household’ the corresponding figure is 8,010 kg CO2-e/year per person.
Total greenhouse gas emissions for Australia in 2014 equate to 22.2 t CO2-e per capita (based on figures from National Greenhouse Gas Inventory and statistica.com). There’s a massive gap between the ‘typical household’ per person emissions, and the national average per capita figure. Some of this is accounted for by services (banking, insurance, health care, education etc.) that are not included in the EPA Victoria calculator. Some will belong to the national ‘structural overhead’—emissions relating to the full spectrum of government services, including relatively emission intensive contributions from military and police. Some will belong to other expenditure outside the household. Some of it will be for upstream emissions associated with consumption that are simply beyond the boundary captured by the calculator. And a significant part will be emissions associated with export-focused extractive industries.
The household-level figures can now be compared with a 2oC compatible emission budget, to see what (if any) remains for air travel. Previously we calculated the individual budget to be 3.1 t CO2-e per person-year for all GHGs, on the basis of a globally equal share per capita. This is a very crude way of thinking about the situation though. Applying it literally would require an immediate step change in total emissions down from around 7.4 t CO2-e per person-year (roughly 55 Gt/year CO2-e total global GHG emissions based on extrapolation from 2012, divided by current global population of 7.4 billion), and then an increase in total emissions as population grows up to 2050, at which point there would then need to be an immediate drop to zero.
Instead the emission rate needs to peak as close as possible to the current level and then smoothly ramp down to zero between now and somewhere out to 2050. The later and the higher the peak, the steeper the subsequent emission reduction rate that is required to remain within the set budget, and the earlier emissions must reach zero. This is depicted in Figure 2.

Figure 2: Relationship between the timing of the peak in global emissions and the subsequent emission reduction curve required to remain within a fixed overall emission budget. Source: Australian Government Climate Change Authority.
Applying this approach to the remaining budget and assuming a 2016 peak in total GHG emissions at the aforementioned 55 Gt CO2-e, the per capita distribution with time is as shown in Figure 3.

Figure 3: Per capita GHG emissions for equal global distribution of a remaining budget of 890 Gt CO2-e.
This now provides us with a coherent benchmark against which to examine in finer detail the notion that air travel can be compatible with serious climate change action.
First though, we need to allocate some part of what I’ve referred to as the national ‘structural overhead’ to my own relatively low-emission household, and to what the Victorian EPA regards as a ‘green household’. To do this I’ll assume that the EPA benchmark for a ‘typical household’ correlates with the national average per capita emissions. I’ll also assume that the national structural overhead scales at the same rate as household emissions. It’s a fairly crude rule of thumb, as there are numerous components of the structural overhead that should be applied equally regardless of household efforts to reduce emissions. But it will do for illustrative purposes here if we assume that it’s broadly representative of future reduction potential. The results are shown in Table 3.
| Emission case | Household level per capita GHG emissions, excluding air travel (t CO2-e per person) | National ‘structural overhead’ per capita GHG emissions (t CO2-e per person) | Total per capita GHG emissions (t CO2-e per person) |
| Typical household | 8.0 | 14.2 | 22.2 |
| Green household | 3.7 | 6.6 | 10.3 |
| My household | 2.7 | 4.8 | 7.5 |
| Global per capita emissions in 2016 | 7.4 |
Table 3: Household level GHG emissions in Australia, with rough allocation of national ‘structural overhead’ by scaling total per capita emissions on the basis of relative household level emissions. Global per capita emissions in 2016 shown for comparison.
Comparing the total for my own household estimate with the global average, there is only a handful of options left for making some amount of air travel compatible within a serious climate response.
Where flights genuinely serve some vitally important and essential social purpose, there’s a case to be made for including them as part of the national ‘structural overhead’ component of 4.8 t CO2-e per person. Some portion of this will indeed be accounted for by government and business air travel already. But I have a hunch that the claims for such recognition might significantly exceed whatever portion of the available budget could be earmarked for air travel while still leaving enough for other essential needs. Were we collectively to agree on this approach, I suspect we’d very quickly conclude that much of what is currently treated as ‘societally essential’ is simply a matter of personal convenience, individual self-interest and straight-out waste.
In saying this, there are certainly situations where I see air travel as justified and important. The problem comes with how far the boundary for that is stretched, in the face of a finite carbon budget. There may well be times that there’s a case to be made on climate mitigation grounds—where the associated emissions are genuinely compensated by the contribution that the travel makes to reductions elsewhere. Earlier this year, Transition Network founder Rob Hopkins published an evaluation of his decision to end a voluntary moratorium on flying. He concluded that, on balance, a trip from the UK to USA was well worth it in terms of the changes he inspired others to make, and I reckon he sets out a convincing case for that. On the other hand, I’d need a lot more convincing that the vast majority of people who attended the COP21 meeting in Paris last year made any material difference to the outcome.
As the second alternative, in order to carve out some headroom for personal travel household emissions could be further reduced below the level reported in Table 3. But with a single round trip from Melbourne to Sydney having a climate impact of 375 kg CO2 (a flight time of just one hour each way), there’s very little to play with. For a Melbourne to London round trip (over 4,500 kg CO2 climate impact) it’s impossible.
The final alternative is to sidestep the inconvenient matters of global social equality and equity, and grab more than a ‘fair’ share of the remaining budget. A great many of us will undoubtedly continue down that path for a good while longer—after all, we’ve been getting away with it for a long time already.
I fully appreciate the compelling personal reasons for making this choice, especially when the emotional implications of geographically dispersed family and friends come into play. It’s not my intent, nor is it my place, to question the legitimacy and authenticity of such choices. They flow from peoples’ deepest and most intimate sources of meaning. Even so, this doesn’t make these choices any more compatible with serious climate response.
Going further though, it raises a question about whether such choices can be compatible with taking climate change seriously at a personal level. What does it mean for this, if I’m prepared to place short term self interest ahead of the long term interests of those who stand to be most adversely affected? Figure 3 makes fairly obvious that the blowback from such a strategy will eventually come home to roost—if not first by those whose interests have been discounted for so long eventually taking matters into their own hands, then via the assaults of a climate system that doesn’t negotiate and is indifferent to my needs.
Conclusions, implications and pathways
The global aviation industry provides, by and large, a luxury convenience enjoyed by a small fraction of the globe’s most affluent citizens. The externalised costs are born mostly by the poorest people in the world. No amount of illusory offsetting will change this.
There is little remaining scope for personal air travel to coexist with the level of action on climate change for which world leaders have reached global consensus—unless the matter of global equity is ignored. But ignoring the equity question is political poison for the prospects of an adequate response to climate change.
Those who now find themselves in the position of leading climate response are often among the greatest beneficiaries of the political-economic arrangements driving the climate crisis. For anything approaching a satisfactory response to this crisis, humanity needs to work together like never before. A great many of those who have benefited least from past emissions now also face the prospect of never seeing the relatively modest levels of economic development necessary for living well, let alone the sort of affluence currently enjoyed in the rich world.
It is time to drop the pretense of taking climate change seriously, while continuing to indulge in what is, per hour, the most carbon-extravagant activity ever devised (though heaven help us if space tourism ever comes to fruition). Indignation over government or corporate inaction on climate change while accumulating frequent flyer miles is a sham.
The world’s richest citizens are responsible for the greatest share of emissions. We therefore have the greatest scope and hold the greatest responsibility for rapid absolute emission reduction. In exercising this responsibility, we hold the key to unlocking the untold political capital that comes with the exercise of personal integrity. If we’re serious about this, and we want others to take us seriously, we need to walk our talk.
References
[1] Kollmuss, Anja, and Allison Myers Crimmins. 2009. Carbon Offsetting & Air Travel Part 2: Non-CO2 Emissions Calculations. In SEI Discussion Paper. Somerville, MA, USA: Stockholm Environment Institute. Viewed 19 August 2016 at http://www.co2offsetresearch.org/PDF/SEI_Air_Travel_Emissions_Paper2_June_09.pdf.
[2] International Civil Aviation Organization Environment Branch. 2013. ICAO Environmental Report 2013. Montreal, Canada: International Civil Aviation Organization. Viewed 19 August 2016 at http://cfapp.icao.int/Environmental-Report-2013/files/assets/common/downloads/ICAO_2013_Environmental_Report.pdf.

Awesome pair of posts Josh. You have certainly made the elephant perfectly visible. That the connection between concern for ‘the future’ and what makes an individual’s life ‘in the present’ more comfortable is a stark example of failed moral equivalency. I would go so far to suggest that if we continue to maintain that we must have a global aviation service (in some sustainable form preferably) in the future then that will be a pretty good surrogate for the first world giving up on taking any effective action on preventing dangerous temperature rise because we just don’t care about what will happen to anyone else other than ourselves. Certainly not the second and third world and obviously not the generations coming after us.
Thanks for those thoughts Peter. I think the thing that got me most motivated to finally write on this is that it’s perhaps the clearest case of our personal aspirations being point-blank incompatible with ‘climate reality’. I can come up with countless arguments for why the benefits of (relatively, for some of us) cheap air travel should be afforded the status of an unassailable good. At a personal level, constructing a moral argument to justify the necessity or importance of a trip is easy — as long as I don’t have to confront the long term climate impacts on the others affected by my action. Bring that into the picture, and it seems to me that no degree of enlightenment can avoid the implications. If we continue on that path, we do so at the cost of harm to others. We might choose to live with that, but we can’t avoid it. Of course, it goes beyond air travel, too. And that’s where it starts to get really confronting, because I have to say, as someone who has made the choice to fly much less, that has been relatively easy compared with what is needed for further significant reductions in other areas.
Such a convincing argument, Josh, we just need everyone who is affluent enough to afford air travel to read it! I am often amazed at how long it takes to change one’s habits, and air travel is clearly a big one for many people. Hopefully we are not too slow in making the necessary changes, as our lives literally do depend on us doing so.
Ruth, it’s probably worth pointing out that I have few illusions that this will have a wide impact on people’s lifestyle choices. But it seems to have provided a few people with pause for thought.